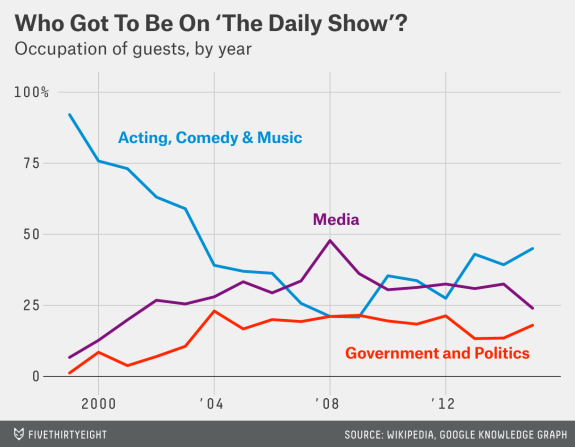
As a learning experience, I recreated this data visualization from FiveThirtyEight’s article, Every Guest Jon Stewart Ever Had On ‘The Daily Show’.
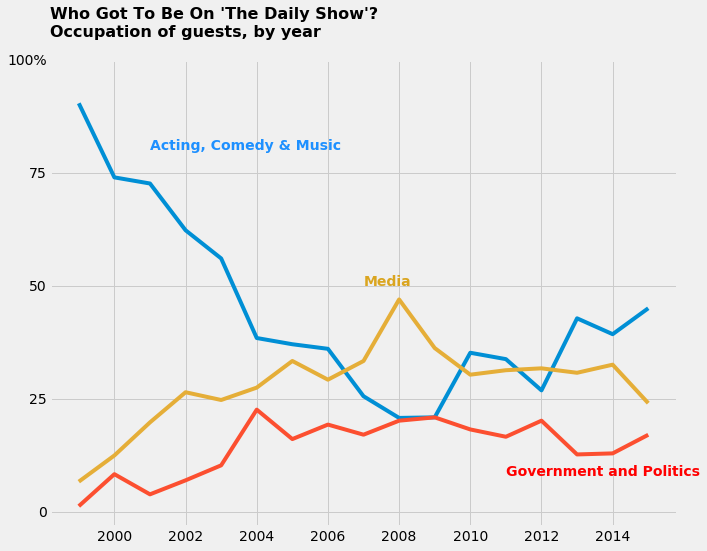
Here was my recreation:
I learned about:
- Exploratory vs Explanatory visualzation
- Pandas data wrangling and crosstabs
- Matplotlib, Numpy, and Pandas plotting
You can see details, including code and comments, in my Colab Notebook.