My first introduction to Kaggle Competitions was a provate project to attempt to predict the functionality of water wells in Tanzania. The original project is here and is run by DrivenData. Our cohort at Lambda School is using this to reinforce our learning of predictive modeling that we have been studying over the past four weeks.
I was excited and nervous to jump into this type of competition, knowing that our class has many brilliant people and not only would I be faced with completing the project to a satiisfactory level, but also to be scored directly against my peers. But it would allow me to see how well I have learned the material up to this point.
We were given trainging and test data but after looking it over, the data was in rough shape and had many columns that were similar to others and most were categorical in nature and would need a great deal of work to get into a proper state for modeling.
The project requirements were such that we had to be able to predict with a 60% accuracy or higher to pass the challenge. This did not seem too difficult, but time would tell. The data did not make me very confident that this would be easy.
To get a quick baseline prediction made and to get a score was the first order of business. This baseline would help to show how much would be needed to get to that 60% mark. So the first step would be to limit features enough to be able to run a quick regression model and submit the prediction for scoring.
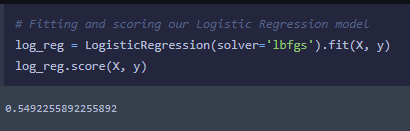
My first intuition was to take just the numeric features and run it through a Logistic Regression model. This would require little data cleaning and would not take long for the model to complete. Got a 54.9% accuracy, this will be a piece of cake!
With using more of the data I should be able to get 60%. So I forged ahead and though I will try OneHot Encoding, as that seemed a pretty good way to deal with categorical data. It does most of the work for you, so I like that idea.
OneHot Encoding works by taking all the unique values within a column and makes new columns in the dataframe for each unique. It does create a much larger dataframe based on the cardinality of the features. Let’s take a look at this data to see what we have.
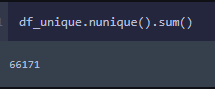
Whoa! Ok, I cant fit a model with 66,171 columns and almost 60,000 observations. My computer couldn’t handle that. I will need to figure out which columns I can toss out to bring this into a reasonable size.
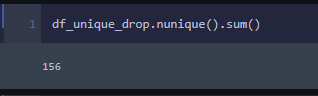
OK, that seems more reasonable. I can compute 156 features much easier than 66k. So off we go to OneHot encode our categorical data and see if we can do another Logistic Regression on the encoded data.
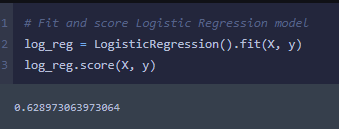
After some further data cleaning I flew past the 60% mark with a new score of 62.9%. This was a good jump from the baseline and I still feel there is room to increase accuracy with more robust models and feature engineering.
Before I move on to other models I wanted to see how much I could improve my accuracy just with Logistic Regression. So with some further thought into which features would best fit my model I made a couple more attempts at Logistic Regression and came up with some better results. My third attempt brought my score up to 69.2% and the fourth effort pushed me up to 71.3%. This was doing mostly basic OneHot encoding but being more picky on which features I was using. I could have went further on this and engineered more features but I felt it was probably close to the limit of what Logistic Regression was going to get me to.
With the project deadline approaching I decided to give two more models a try, RandomForests and XGBoost. Several of my peers were having success with both of these so I wanted to see how I compared with their scores.
Using the same features that I used in my prior high scored model, I used a little different method to get the data ready for the model. I used the pandas factorize method. While it is similar to OneHot encoding, instead of creating additional columns it gives a unique numerical for each unique value in a column. Makes the dataframe a little easier to visualize and understand, to me.
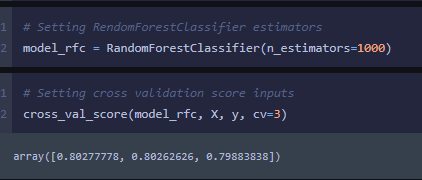
After getting the data ready I ran a cross validation score on my RandomForest model and was pleasantly surprised that the score was much higher than previously.
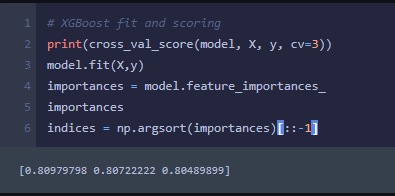
I then went to try the XGBoost. This model is considered the Kaggle champion, as it is used quite often by winners of their competitions. I am not entirely sure how it works entirely, but I may as well find out by running some tests.
My XGBoost scores came out to be just slightly better than the RandomForest scores.
As the project is nearing its completion I wanted to reflect on what I learned from this project. I mostly learned that data cleaning and preperation is the most likely thing to ensure a good prediction. Making sure your using the best data and it is in the best shape will help all models be more accurate.
Another thing I learned is I don’t know enough about these models but I can’t wait to keep using them more and finding out which model to use and when. It was a fun experience and although I didn’t ultimately score the highest I feel that I will be better next time.
Lambda School!